Grundläggande statistik
| Institutionella ägare | 168 total, 164 long only, 0 short only, 4 long/short - change of 0,00% MRQ |
| Genomsnittlig portföljallokering | 0.1625 % - change of 108,34% MRQ |
| Institutionella aktier (lång) | 59 109 051 (ex 13D/G) - change of 0,28MM shares 2,96% MRQ |
| Institutionellt värde (lång) | $ 544 392 USD ($1000) |
Institutionellt ägande och aktieägare
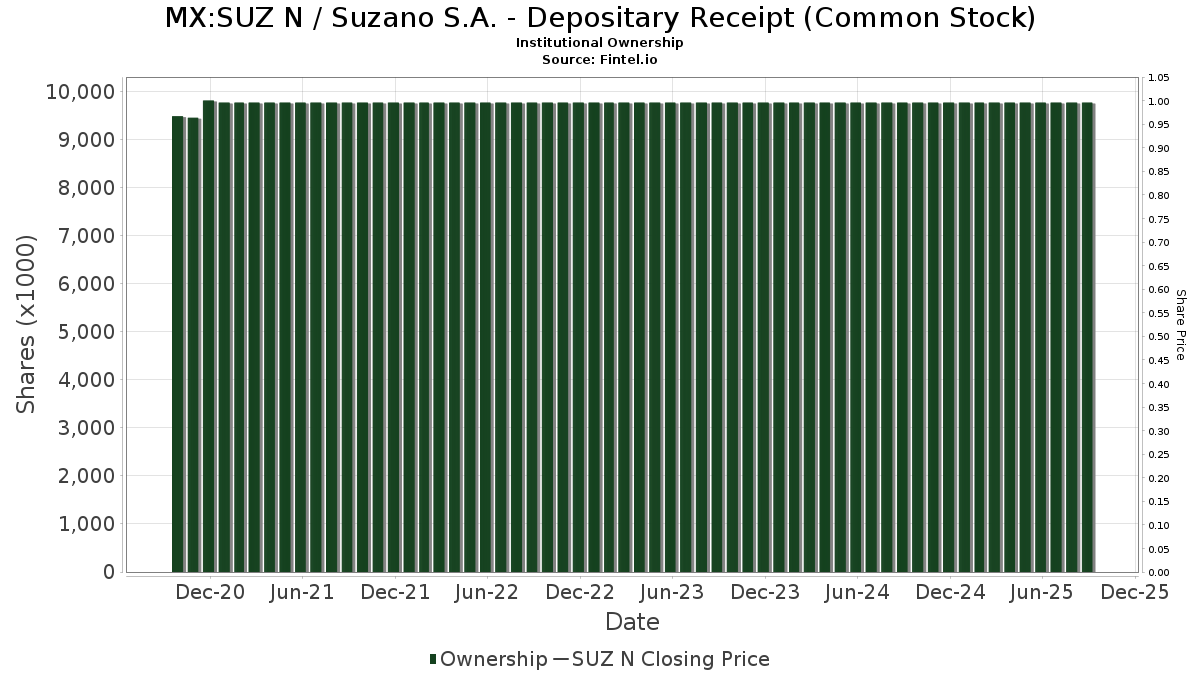
Suzano S.A. - Depositary Receipt (Common Stock) (MX:SUZ N) har 168 Institutionella ägare och aktieägare som har lämnat in 13D/G- eller 13F-formulär till Securities Exchange Commission (SEC). Dessa institut innehar totalt 59,109,051 aktier. Största aktieägare inkluderar Atlas FRM LLC, UBS Group AG, State Street Corp, GNR - SPDR(R) S&P(R) Global Natural Resources ETF, DZ BANK AG Deutsche Zentral Genossenschafts Bank, Frankfurt am Main, Goldman Sachs Group Inc, Morgan Stanley, Bank Of America Corp /de/, Millennium Management Llc, and American Century Companies Inc .
Suzano S.A. - Depositary Receipt (Common Stock) (BMV:SUZ N) Institutionell ägarstruktur visar institutioners och fonders nuvarande positioner i företaget, samt de senaste förändringarna i positionernas storlek. Större aktieägare kan vara enskilda investerare, fonder, hedgefonder eller institutioner. Bilaga 13D visar att investeraren äger (eller ägde) mer än 5% av företaget och avser (eller avsåg) att aktivt eftersträva en förändring av affärsstrategin. Schedule 13G indikerar en passiv investering på över 5%.
Fondsentimentets poäng
Fondsentimentet poängen(fka Ägarackumulation-poäng) visar vilka aktier som är mest köpta av fonder. Det är resultatet av en sofistikerad kvantitativ flerfaktormodell som identifierar företag med de högsta nivåerna av institutionell ackumulering. Poängsättningsmodellen använder en kombination av den totala ökningen av redovisade ägare, förändringarna i portföljallokeringarna för dessa ägare och andra mått. Siffran sträcker sig från 0 till 100, där högre siffror indikerar en högre nivå av ackumulering i förhållande till sina konkurrenter, och 50 är genomsnittet.
Uppdateringsfrekvens: Dagligen
Se Ownership Explorer, som innehåller en lista över de högst rankade företagen.
13F- och NPORT-arkiveringar
Detaljer om 13F-arkiveringar är gratis. Detaljer om NP-arkiveringar kräver ett premiummedlemskap. Gröna rader indikerar nya positioner. Röda rader indikerar stängda positioner. Klicka på länk symbolen för att se hela transaktionshistoriken.
Uppgradera
för att låsa upp premiumdata och exportera till Excel ![]() .
.
| Fil Datum | Källa | Investerare | Typ | Genomsnittligt pris (beräknat) |
Aktier | Δ Aktier (%) |
Rapporterat värde (1000 USD) |
Δ Värde (%) |
Portföljallokering (%) |
|
|---|---|---|---|---|---|---|---|---|---|---|
| 2025-08-14 | 13F | UBS Group AG | 4 957 731 | 89,26 | 46 652 | 91,70 | ||||
| 2025-08-14 | 13F | UBS Group AG | Call | 514 600 | 4 842 | |||||
| 2025-08-14 | 13F | Boston Private Wealth Llc | 0 | −100,00 | 0 | |||||
| 2025-08-14 | 13F | Raymond James Financial Inc | 962 | 9 | ||||||
| 2025-08-14 | 13F | Engineers Gate Manager LP | 25 162 | −69,41 | 237 | −69,11 | ||||
| 2025-08-14 | 13F | Cubist Systematic Strategies, LLC | 0 | −100,00 | 0 | |||||
| 2025-08-14 | 13F | UBS Group AG | Put | 892 000 | 120,30 | 8 394 | 123,16 | |||
| 2025-07-10 | 13F | Arkfeld Wealth Strategies, L.L.C. | 45 535 | −49,56 | 424 | −47,58 | ||||
| 2025-08-14 | 13F | Group One Trading, L.p. | 6 300 | 59 | ||||||
| 2025-05-14 | 13F | Ameriprise Financial Inc | 0 | −100,00 | 0 | |||||
| 2025-08-13 | 13F | Flow Traders U.s. Llc | 12 034 | 0 | ||||||
| 2025-08-14 | 13F | Vident Advisory, LLC | 10 359 | 97 | ||||||
| 2025-08-14 | 13F | State Street Corp | 4 257 445 | −0,82 | 40 063 | 0,47 | ||||
| 2025-08-14 | 13F | Royal Bank Of Canada | 628 608 | 910,71 | 5 916 | 923,53 | ||||
| 2025-08-14 | 13F | Citadel Advisors Llc | Call | 0 | −100,00 | 0 | −100,00 | |||
| 2025-08-14 | 13F | BTG Pactual Asset Management US LLC | 0 | −100,00 | 0 | |||||
| 2025-06-26 | NP | DEHP - Dimensional Emerging Markets High Profitability ETF | 70 800 | 461,90 | 627 | 361,03 | ||||
| 2025-08-12 | 13F | MAI Capital Management | 1 985 | 19 | ||||||
| 2025-08-06 | 13F | Metis Global Partners, LLC | 232 174 | 24,83 | 2 185 | 26,46 | ||||
| 2025-07-24 | 13F | Lester Murray Antman dba SimplyRich | 21 755 | −37,74 | 0 | |||||
| 2025-06-23 | NP | UUPIX - Ultraemerging Markets Profund Investor Class | 2 799 | 6,75 | 25 | −14,29 | ||||
| 2025-08-13 | 13F | Rsm Us Wealth Management Llc | 11 735 | −5,78 | 110 | −4,35 | ||||
| 2025-08-27 | 13F/A | Squarepoint Ops LLC | 0 | −100,00 | 0 | −100,00 | ||||
| 2025-08-07 | NP | OTGAX - OTG Latin America Fund Class A Shares | 57 500 | 10,58 | 541 | 12,01 | ||||
| 2025-08-12 | 13F | Pathstone Holdings, LLC | 11 165 | −12,25 | 105 | −11,02 | ||||
| 2025-05-01 | 13F | Ballentine Partners, LLC | 0 | −100,00 | 0 | |||||
| 2025-07-28 | NP | AVSE - Avantis Responsible Emerging Markets Equity ETF | 26 098 | 13,25 | 227 | 2,26 | ||||
| 2025-05-13 | 13F | Ranmore Fund Management Ltd | 0 | −100,00 | 0 | |||||
| 2025-07-18 | 13F | Robeco Institutional Asset Management B.V. | 40 486 | −27,23 | 381 | −26,36 | ||||
| 2025-07-14 | 13F | Abound Wealth Management | 15 | 0,00 | 0 | |||||
| 2025-07-28 | NP | AVEM - Avantis Emerging Markets Equity ETF This fund is a listed as child fund of American Century Companies Inc and if that institution has disclosed ownership in this security, then these positions will not be double counted when calculating total shares and total value | 1 198 028 | 28,56 | 10 399 | 16,11 | ||||
| 2025-07-30 | NP | BRAZ - Global X Brazil Active ETF | 14 289 | 65,82 | 124 | 51,22 | ||||
| 2025-08-14 | 13F | Optiver Holding B.V. | 222 635 | 1 059,20 | 2 095 | 1 076,40 | ||||
| 2025-08-15 | 13F | Binnacle Investments Inc | 0 | −100,00 | 0 | |||||
| 2025-08-14 | 13F | Dynamo Internacional Gestao De Recursos Ltda. | 389 234 | 0,00 | 3 663 | 1,30 | ||||
| 2025-08-14 | 13F | Quantinno Capital Management LP | 57 320 | 54,57 | 539 | 56,69 | ||||
| 2025-07-10 | 13F | Moody National Bank Trust Division | 27 873 | 0,00 | 262 | 1,55 | ||||
| 2025-08-07 | 13F | Campbell & CO Investment Adviser LLC | 56 620 | −68,55 | 533 | −68,18 | ||||
| 2025-06-11 | NP | SLANX - DWS Latin America Equity Fund Class A | 37 800 | 94,85 | 335 | 53,21 | ||||
| 2025-07-15 | 13F | Compagnie Lombard Odier SCmA | 12 515 | 0,00 | 118 | 0,86 | ||||
| 2025-08-14 | 13F | Wells Fargo & Company/mn | 100 | 0,00 | 1 | |||||
| 2025-08-15 | 13F | Tower Research Capital LLC (TRC) | 2 083 | 20 | ||||||
| 2025-07-31 | 13F | Brinker Capital Investments, LLC | 0 | −100,00 | 0 | |||||
| 2025-08-13 | 13F | Groupama Asset Managment | 30 210 | 1,77 | 281 | 2,19 | ||||
| 2025-08-12 | 13F | Global Retirement Partners, LLC | 567 | 5 | ||||||
| 2025-08-04 | 13F | Waterfront Wealth Inc. | 317 605 | 2,20 | 2 989 | 3,50 | ||||
| 2025-07-24 | 13F | Us Bancorp \de\ | 6 993 | −18,37 | 66 | −17,72 | ||||
| 2025-08-14 | 13F | Fmr Llc | 3 181 | 25,24 | 30 | 26,09 | ||||
| 2025-08-14 | 13F | Wetherby Asset Management Inc | 31 387 | 41,98 | 295 | 32,29 | ||||
| 2025-08-11 | 13F | EntryPoint Capital, LLC | 19 132 | −35,76 | 180 | −34,78 | ||||
| 2025-07-16 | 13F | Signaturefd, Llc | 5 651 | −1,09 | 53 | 0,00 | ||||
| 2025-08-14 | 13F | Balyasny Asset Management Llc | 465 964 | 4,92 | 4 385 | 6,28 | ||||
| 2025-07-29 | NP | RBB FUND, INC. - Aquarius International Fund | 6 573 | 0,00 | 57 | −9,52 | ||||
| 2025-08-14 | 13F | Susquehanna International Group, Llp | Put | 19 800 | 96,04 | 186 | 100,00 | |||
| 2025-07-24 | 13F | Grace & White Inc /ny | 81 974 | 0,00 | 771 | 1,31 | ||||
| 2025-08-15 | 13F | WealthCollab, LLC | 0 | −100,00 | 0 | |||||
| 2025-07-31 | 13F | Carrera Capital Advisors | 0 | −100,00 | 0 | |||||
| 2025-08-08 | 13F | Creative Planning | 31 299 | −31,75 | 295 | −30,99 | ||||
| 2025-08-14 | 13F | Van Eck Associates Corp | 63 656 | 1,09 | 1 | |||||
| 2025-08-14 | 13F | Janus Henderson Group Plc | 848 857 | 7 992 | ||||||
| 2025-08-13 | 13F | Fisher Asset Management, LLC | 140 222 | −16,28 | 1 319 | −15,23 | ||||
| 2025-08-14 | 13F | Susquehanna International Group, Llp | Call | 102 700 | 179,84 | 966 | 184,12 | |||
| 2025-09-04 | 13F/A | Advisor Group Holdings, Inc. | 111 | 12,12 | 1 | |||||
| 2025-08-14 | 13F | Two Sigma Investments, Lp | 1 193 855 | 3,56 | 11 234 | 4,90 | ||||
| 2025-08-14 | 13F | Bank Of America Corp /de/ | 2 267 395 | −26,63 | 21 336 | −25,68 | ||||
| 2025-08-14 | 13F | Hrt Financial Lp | 29 332 | 183,78 | 0 | |||||
| 2025-08-28 | NP | GNR - SPDR(R) S&P(R) Global Natural Resources ETF | 3 816 202 | −1,49 | 35 910 | −0,22 | ||||
| 2025-04-30 | 13F | Sofos Investments, Inc. | 35 | 3 400,00 | 0 | |||||
| 2025-08-14 | 13F | Smartleaf Asset Management LLC | 0 | −100,00 | 0 | |||||
| 2025-08-13 | 13F | Northern Trust Corp | 895 153 | −4,84 | 8 423 | −3,62 | ||||
| 2025-07-24 | 13F | Ronald Blue Trust, Inc. | 909 | −79,30 | 9 | −80,00 | ||||
| 2025-06-26 | NP | DFCEX - Emerging Markets Core Equity Portfolio - Institutional Class This fund is a listed as child fund of Dimensional Fund Advisors Lp and if that institution has disclosed ownership in this security, then these positions will not be double counted when calculating total shares and total value | 59 174 | 0,00 | 524 | −18,00 | ||||
| 2025-08-11 | 13F | Principal Securities, Inc. | 97 | 1 | ||||||
| 2025-08-12 | 13F | Aigen Investment Management, Lp | 0 | −100,00 | 0 | |||||
| 2025-08-27 | NP | RYWTX - Emerging Markets 2x Strategy Fund Class A | 3 698 | 153,46 | 35 | 161,54 | ||||
| 2025-08-13 | 13F | EverSource Wealth Advisors, LLC | 2 402 | 700,67 | 23 | 1 000,00 | ||||
| 2025-08-13 | 13F | Provida Pension Fund Administrator | 0 | −100,00 | 0 | −100,00 | ||||
| 2025-07-16 | 13F | Highline Wealth Partners Llc | 0 | −100,00 | 0 | |||||
| 2025-08-28 | NP | Principal Diversified Select Real Asset Fund | 9 093 | −1,02 | 86 | 0,00 | ||||
| 2025-05-05 | 13F | Lindbrook Capital, Llc | 1 747 | −41,84 | 16 | −46,67 | ||||
| 2025-08-08 | 13F | Financial Gravity Companies, Inc. | 17 | −51,43 | 0 | |||||
| 2025-06-18 | NP | RTXAX - Tax-Managed Real Assets Fund Class A | 144 902 | 38,68 | 1 284 | 13,74 | ||||
| 2025-08-28 | NP | QEMM - SPDR MSCI Emerging Markets StrategicFactors ETF | 1 055 | −3,92 | 10 | −10,00 | ||||
| 2025-07-30 | 13F | DekaBank Deutsche Girozentrale | 778 866 | −0,07 | 7 | 0,00 | ||||
| 2025-08-14 | 13F | Jane Street Group, Llc | Put | 31 500 | 296 | |||||
| 2025-08-14 | 13F | Jane Street Group, Llc | Call | 18 900 | 178 | |||||
| 2025-08-14 | 13F | Jane Street Group, Llc | 77 468 | −6,39 | 729 | −5,21 | ||||
| 2025-08-08 | 13F | Pnc Financial Services Group, Inc. | 11 958 | 10,55 | 113 | 12,00 | ||||
| 2025-05-12 | 13F | Virtu Financial LLC | 0 | −100,00 | 0 | |||||
| 2025-07-21 | 13F | Mirae Asset Global Investments Co., Ltd. | 37 887 | −94,56 | 357 | −94,09 | ||||
| 2025-08-13 | 13F | Marshall Wace, Llp | 921 337 | −54,48 | 8 670 | −53,90 | ||||
| 2025-08-05 | 13F | ANTIPODES PARTNERS Ltd | 205 166 | −45,33 | 1 931 | −44,64 | ||||
| 2025-08-12 | 13F | Dimensional Fund Advisors Lp | 313 027 | 13,66 | 2 946 | 15,13 | ||||
| 2025-08-11 | 13F | Citigroup Inc | 90 102 | 1,23 | 848 | 2,54 | ||||
| 2025-08-07 | 13F | Allworth Financial LP | 647 | 138,75 | 6 | 200,00 | ||||
| 2025-05-15 | 13F | Old Mission Capital Llc | 0 | −100,00 | 0 | −100,00 | ||||
| 2025-08-13 | 13F | PineBridge Investments, L.P. | 121 030 | 0,00 | 1 139 | 1,25 | ||||
| 2025-08-14 | 13F | Bridgefront Capital, LLC | 13 439 | −38,34 | 126 | −37,62 | ||||
| 2025-05-19 | 13F | Ubs Asset Management Americas Inc | 0 | −100,00 | 0 | |||||
| 2025-08-12 | 13F | Rhumbline Advisers | 12 163 | 12,87 | 114 | 14,00 | ||||
| 2025-08-14 | 13F | Qube Research & Technologies Ltd | 314 124 | −32,79 | 2 956 | −31,93 | ||||
| 2025-08-14 | 13F | Graham Capital Management, L.P. | 66 811 | 51,87 | 629 | 53,92 | ||||
| 2025-07-24 | 13F | Ramirez Asset Management, Inc. | 0 | −100,00 | 0 | |||||
| 2025-07-25 | 13F | Yousif Capital Management, Llc | 20 457 | 0,00 | 192 | 1,05 | ||||
| 2025-08-14 | 13F | Goldman Sachs Group Inc | 3 577 018 | 541,77 | 33 660 | 550,16 | ||||
| 2025-08-14 | 13F | MIRAE ASSET GLOBAL ETFS HOLDINGS Ltd. | 14 289 | 42,65 | 134 | 44,09 | ||||
| 2025-08-26 | NP | Profunds - Profund Vp Emerging Markets | 11 863 | 13,67 | 112 | 15,63 | ||||
| 2025-07-28 | NP | AVXC - Avantis Emerging Markets ex-China Equity ETF | 23 810 | 55,87 | 207 | 41,10 | ||||
| 2025-08-14 | 13F | Two Sigma Advisers, Lp | 1 232 100 | 3,72 | 11 594 | 5,07 | ||||
| 2025-08-11 | 13F | Vanguard Group Inc | 241 245 | 89,10 | 2 270 | 91,56 | ||||
| 2025-08-13 | 13F | Pictet Asset Management Holding SA | 156 532 | −56,65 | 1 473 | −56,11 | ||||
| 2025-06-26 | NP | DFSE - Dimensional Emerging Markets Sustainability Core 1 ETF | 12 572 | 38,15 | 111 | 13,27 | ||||
| 2025-08-13 | 13F | Guggenheim Capital Llc | 57 091 | −13,91 | 537 | −12,82 | ||||
| 2025-08-07 | 13F | Sierra Ocean, Llc | 115 | 1 | ||||||
| 2025-08-12 | 13F | Coldstream Capital Management Inc | 0 | −100,00 | 0 | |||||
| 2025-08-14 | 13F/A | Skopos Labs, Inc. | 21 986 | 1 026,91 | 207 | 1 044,44 | ||||
| 2025-08-12 | 13F | SPX Equities Gestao de Recursos Ltda | 172 511 | −4,61 | 1 623 | −3,39 | ||||
| 2025-05-15 | 13F | Cullen Capital Management, LLC | 19 595 | 19,01 | 182 | 9,64 | ||||
| 2025-08-13 | 13F | Renaissance Technologies Llc | 317 700 | 5,80 | 2 990 | 7,17 | ||||
| 2025-07-28 | 13F | Harbour Investments, Inc. | 49 | 0,00 | 0 | |||||
| 2025-08-08 | 13F | Crossmark Global Holdings, Inc. | 34 897 | −0,11 | 328 | 1,23 | ||||
| 2025-08-14 | 13F | Aqr Capital Management Llc | 38 050 | 17,30 | 358 | 18,94 | ||||
| 2025-08-12 | 13F | Trexquant Investment LP | 138 896 | 1 307 | ||||||
| 2025-07-24 | 13F | Jfs Wealth Advisors, Llc | 90 | −61,37 | 1 | −100,00 | ||||
| 2025-07-25 | 13F | Cwm, Llc | 1 027 | −38,36 | 0 | |||||
| 2025-07-08 | 13F | Parallel Advisors, LLC | 5 440 | 21,92 | 51 | 24,39 | ||||
| 2025-07-11 | 13F | Farther Finance Advisors, LLC | 523 | 515,29 | 5 | |||||
| 2025-06-26 | NP | DFEV - Dimensional Emerging Markets Value ETF | 1 600 | 0,00 | 14 | −17,65 | ||||
| 2025-06-26 | NP | SNTKX - Steward International Enhanced Index Fund Class A | 25 371 | 0,00 | 225 | −18,25 | ||||
| 2025-08-13 | 13F | Brandes Investment Partners, Lp | 170 535 | 23,89 | 1 605 | 25,51 | ||||
| 2025-06-26 | NP | DVRAX - MFS Global Alternative Strategy Fund A | 4 894 | −0,45 | 43 | −18,87 | ||||
| 2025-08-14 | 13F | Aquatic Capital Management LLC | 0 | −100,00 | 0 | |||||
| 2025-08-11 | 13F | Absolute Gestao de Investimentos Ltda. | 0 | −100,00 | 0 | |||||
| 2025-07-28 | NP | NSI - National Security Emerging Markets Index ETF | 1 037 | 38,82 | 9 | 28,57 | ||||
| 2025-07-31 | 13F | R Squared Ltd | 0 | −100,00 | 0 | |||||
| 2025-08-14 | 13F/A | Barclays Plc | 10 650 | 0,00 | 0 | |||||
| 2025-06-26 | NP | DEXC - Dimensional Emerging Markets ex China Core Equity ETF | 16 300 | 27,34 | 144 | 4,35 | ||||
| 2025-08-14 | 13F | Citadel Advisors Llc | 76 086 | −66,05 | 716 | −65,66 | ||||
| 2025-08-11 | 13F | Brown Brothers Harriman & Co | 265 | 2 | ||||||
| 2025-08-14 | 13F | Citadel Advisors Llc | Put | 15 000 | −2,60 | 141 | −1,40 | |||
| 2025-08-13 | 13F | Channing Global Advisors, Llc | 261 | 16,00 | 2 | 0,00 | ||||
| 2025-08-14 | 13F | Mariner, LLC | 26 217 | 119,35 | 247 | 121,62 | ||||
| 2025-08-14 | 13F | Bnp Paribas Arbitrage, Sa | 383 436 | −50,41 | 3 608 | −49,76 | ||||
| 2025-04-17 | 13F | Constellation Investimentos e Participacoes Ltda | 0 | −100,00 | 0 | |||||
| 2025-03-28 | NP | DFAX - Dimensional World ex U.S. Core Equity 2 ETF | 3 960 | 0,00 | 43 | 5,00 | ||||
| 2025-08-14 | 13F | Millennium Management Llc | 1 844 894 | 18,86 | 17 360 | 20,40 | ||||
| 2025-08-14 | 13F | Bizma Investimentos Ltda | 344 547 | 0,00 | 3 242 | 1,31 | ||||
| 2025-08-11 | 13F | Cornerstone Planning Group LLC | 16 | 0,00 | 0 | |||||
| 2025-08-08 | 13F | Principal Financial Group Inc | 99 300 | −45,19 | 934 | −44,50 | ||||
| 2025-08-07 | 13F | Profund Advisors Llc | 30 970 | 0,97 | 291 | 2,46 | ||||
| 2025-08-14 | 13F | VPR Management LLC | 58 835 | 0,00 | 554 | 1,28 | ||||
| 2025-07-15 | 13F | Financial Management Professionals, Inc. | 0 | −100,00 | 0 | |||||
| 2025-07-28 | NP | AVEEX - Avantis Emerging Markets Equity Fund Institutional Class This fund is a listed as child fund of American Century Companies Inc and if that institution has disclosed ownership in this security, then these positions will not be double counted when calculating total shares and total value | 78 919 | 3,91 | 685 | −6,04 | ||||
| 2025-06-26 | NP | DFEM - Dimensional Emerging Markets Core Equity 2 ETF | 24 300 | 43,79 | 215 | 18,13 | ||||
| 2025-08-12 | 13F | XTX Topco Ltd | 0 | −100,00 | 0 | |||||
| 2025-08-14 | 13F | Headlands Technologies LLC | 17 567 | 479,96 | 165 | 489,29 | ||||
| 2025-08-12 | 13F | Jpmorgan Chase & Co | 245 695 | 109,57 | 2 312 | 112,21 | ||||
| 2025-08-06 | 13F | True Wealth Design, LLC | 55 | 14,58 | 1 | |||||
| 2025-08-08 | 13F | SG Americas Securities, LLC | 17 123 | 0 | ||||||
| 2025-08-14 | 13F | Susquehanna International Group, Llp | 0 | −100,00 | 0 | −100,00 | ||||
| 2025-08-05 | 13F | Simplex Trading, Llc | 19 135 | 534,66 | 0 | |||||
| 2025-08-14 | 13F | Point72 Asset Management, L.P. | 0 | −100,00 | 0 | |||||
| 2025-08-14 | 13F | DZ BANK AG Deutsche Zentral Genossenschafts Bank, Frankfurt am Main | 3 640 283 | 0,00 | 34 255 | 1,29 | ||||
| 2025-08-14 | 13F | Atomi Financial Group, Inc. | 16 684 | 41,52 | 157 | 43,12 | ||||
| 2025-08-21 | NP | HAP - VanEck Vectors Natural Resources ETF | 59 513 | 1,16 | 560 | 2,56 | ||||
| 2025-07-14 | 13F | Kapitalo Investimentos Ltda | 695 916 | 57,95 | 6 549 | 59,98 | ||||
| 2025-08-04 | 13F | Hantz Financial Services, Inc. | 16 161 | 2 034,87 | 0 | |||||
| 2025-08-12 | 13F | Deutsche Bank Ag\ | 205 049 | −2,76 | 1 930 | −1,53 | ||||
| 2025-08-11 | 13F | TD Waterhouse Canada Inc. | 10 800 | 17 900,00 | 100 | 9 900,00 | ||||
| 2025-07-14 | 13F | GAMMA Investing LLC | 1 107 | −10,51 | 10 | −9,09 | ||||
| 2025-07-31 | 13F | Caitong International Asset Management Co., Ltd | 0 | −100,00 | 0 | |||||
| 2025-07-28 | 13F | Ritholtz Wealth Management | 15 759 | −27,25 | 148 | −26,37 | ||||
| 2025-08-13 | 13F | Quantbot Technologies LP | 93 205 | 33,28 | 877 | 35,13 | ||||
| 2025-07-25 | NP | PRDAX - Diversified Real Asset Fund Class A | 108 290 | 48,99 | 940 | 34,53 | ||||
| 2025-05-14 | 13F | Credit Agricole S A | 3 870 | 0,00 | 36 | −10,26 | ||||
| 2025-08-13 | 13F | Quadrant Capital Group Llc | 36 714 | 280,65 | 345 | 287,64 | ||||
| 2025-08-12 | 13F | Proequities, Inc. | 0 | 0 | ||||||
| 2025-08-14 | 13F | Erste Asset Management GmbH | 60 454 | 562 | ||||||
| 2025-08-28 | NP | SPEM - SPDR(R) Portfolio Emerging Markets ETF | 412 101 | 6,67 | 3 878 | 8,02 | ||||
| 2025-08-14 | 13F | Mml Investors Services, Llc | 34 500 | 0 | ||||||
| 2025-08-08 | 13F | SBI Securities Co., Ltd. | 140 | 250,00 | 1 | |||||
| 2025-08-12 | 13F | CIBC Private Wealth Group, LLC | 2 167 | 8,35 | 20 | 25,00 | ||||
| 2025-08-14 | 13F | Banco BTG Pactual S.A. | 23 706 | 46,33 | 223 | 48,67 | ||||
| 2025-08-15 | 13F | Morgan Stanley | 2 359 401 | 4,69 | 22 202 | 6,04 | ||||
| 2025-08-04 | 13F | Assetmark, Inc | 64 | 611,11 | 1 | |||||
| 2025-08-12 | 13F | Legal & General Group Plc | 55 121 | 0,00 | 519 | 1,37 | ||||
| 2025-08-08 | 13F | Itau Unibanco Holding S.A. | 870 012 | 0,00 | 6 401 | 91 328,57 | ||||
| 2025-08-11 | 13F | Bell Investment Advisors, Inc | 69 | 23,21 | 1 | |||||
| 2025-04-21 | 13F | Nelson, Van Denburg & Campbell Wealth Management Group, LLC | 0 | −100,00 | 0 | |||||
| 2025-07-25 | NP | NRES - Xtrackers RREEF Global Natural Resources ETF | 55 091 | 55,84 | 478 | 41,00 | ||||
| 2025-08-13 | 13F | Atlas FRM LLC | 17 320 000 | 0,00 | 162 981 | 1,29 | ||||
| 2025-08-14 | 13F | Schonfeld Strategic Advisors LLC | 40 640 | −71,45 | 382 | −71,10 | ||||
| 2025-08-14 | 13F | Voloridge Investment Management, Llc | 142 296 | 1 339 | ||||||
| 2025-06-23 | NP | UBPIX - Ultralatin America Profund Investor Class | 13 801 | −6,18 | 122 | −22,78 | ||||
| 2025-08-12 | 13F | BlackRock, Inc. | 678 806 | 9,15 | 6 388 | 10,56 | ||||
| 2025-04-24 | NP | OAEM - OneAscent Emerging Markets ETF | 76 427 | −20,69 | 734 | −26,38 | ||||
| 2025-05-16 | 13F | Jones Financial Companies Lllp | 0 | −100,00 | 0 | |||||
| 2025-08-13 | 13F | Russell Investments Group, Ltd. | 144 902 | 38,68 | 1 364 | 40,52 | ||||
| 2025-06-23 | NP | Global Opportunities Portfolio - Global Opportunities Portfolio | 209 100 | 1 853 | ||||||
| 2025-08-14 | 13F | Verition Fund Management LLC | 44 051 | −16,47 | 415 | −15,34 | ||||
| 2025-08-12 | 13F | Atlas Capital Advisors Llc | 2 341 | 0,00 | 22 | 4,76 | ||||
| 2025-08-07 | 13F | Parkside Financial Bank & Trust | 122 | −40,78 | 1 | 0,00 | ||||
| 2025-08-12 | 13F | American Century Companies Inc | 1 591 333 | 36,19 | 14 974 | 37,96 | ||||
| 2025-07-25 | 13F | JustInvest LLC | 22 503 | 15,26 | 212 | 16,57 | ||||
| 2025-08-13 | 13F | Amundi | 0 | −100,00 | 0 | |||||
| 2025-08-12 | 13F | O'shaughnessy Asset Management, Llc | 42 889 | −24,86 | 404 | −23,96 | ||||
| 2025-07-28 | NP | AVES - Avantis Emerging Markets Value ETF This fund is a listed as child fund of American Century Companies Inc and if that institution has disclosed ownership in this security, then these positions will not be double counted when calculating total shares and total value | 221 813 | 256,87 | 1 925 | 222,45 | ||||
| 2025-06-26 | NP | DFAE - Dimensional Emerging Core Equity Market ETF | 87 700 | 56,05 | 777 | 28,22 | ||||
| 2025-05-14 | 13F | CIBC World Markets Inc. | 0 | −100,00 | 0 |